Learn How to Make Fast Money by Learning diffrent Strategies in Forex Trading and Different Investment Options
EUR/USD Trading Guide: Complete Strategy for the World’s Most Traded Pair
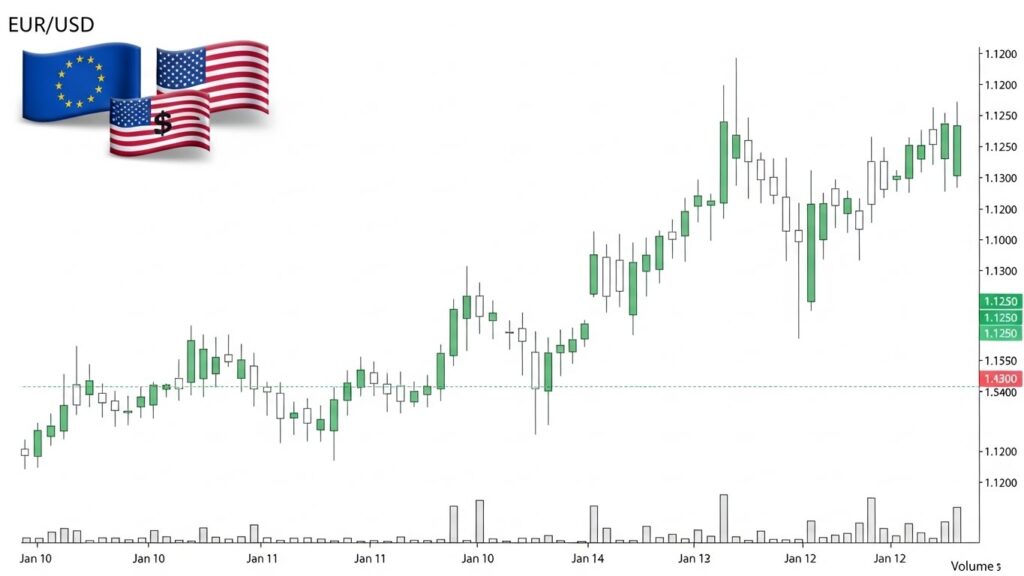
No currency pair dominates forex like EUR/USD. It accounts for roughly 24% of all daily trading volume — more than $1.5 trillion changing hands every single day. The liquidity is unmatched, the spreads are the tightest in the market, and the price action is consistent enough to trade across every timeframe from 1-minute scalping charts to weekly swing setups.
This guide covers everything you need for EUR/USD trading. You’ll learn how the pair behaves and why, which strategies suit it best, when the optimal trading windows are, and what the key fundamental drivers are that move it most. Whether you’re choosing your first currency pair or sharpening an approach you’ve been using for years, everything you need is here.
EUR/USD represents the exchange rate between the European Union’s 27-nation bloc and the United States — the two largest economic zones on the planet. That combination gives EUR/USD trading characteristics unlike anything else in the forex market.
Key Advantages of Trading EUR/USD
Tightest Spreads
EUR/USD consistently delivers the lowest transaction costs in retail forex. ECN brokers typically quote spreads of 0.1–0.3 pips, and standard accounts run 0.5–1.0 pips. Those low costs work in your favor regardless of your style — scalpers can target small price moves and still profit, day traders start each position closer to breakeven, and swing traders lose less to transaction costs across multi-day holds.
Maximum Liquidity
With more daily volume than any other currency pair, EUR/USD fills orders fast and at the price you want. Slippage is minimal even on larger positions, and entries and exits are smooth under normal market conditions. The exception comes around major scheduled news events, where brief but violent spikes can occur before liquidity returns to normal.
Predictable Price Action
EUR/USD respects technical levels more consistently than most major pairs. Support and resistance hold, chart patterns complete cleanly, trend lines carry genuine weight, and moving averages serve as meaningful reference points. That reliability makes it possible to build rule-based strategies and trust the setups you’re trading.
Abundant Information
More analysis, research, and educational content exists on EUR/USD than on any other currency pair. Historical data stretches back decades for backtesting, real-time news coverage is constant, and trade ideas and economic forecasts flow from analysts around the world at all hours. Context is never in short supply.
Moderate Volatility
EUR/USD volatility sits in a comfortable middle ground. Under normal market conditions the daily range runs 60–100 pips — enough movement to generate meaningful profits across all trading styles. During major news releases or periods of market stress, that range can extend to 150–200 pips or more, creating bigger opportunities for those prepared to handle them.
Who Should Trade EUR/USD?
EUR/USD works well across most trading styles. Beginners benefit from the enormous volume of educational resources built around the pair. Scalpers appreciate the tight spreads that make small profit targets viable. Day traders get reliable intraday movement and deep liquidity throughout European and American sessions. Swing traders find clear trends and technical levels that hold up. Automated traders value the consistent price behavior that lets expert advisors perform as designed.
That said, EUR/USD isn’t the right fit for every situation. If you need extreme volatility, GBP/USD offers wider daily ranges. If you trade exclusively during Asian session hours, EUR/USD is at its quietest then and you’d be better served by pairs that move more during those hours. And if your preference runs toward commodity or exotic currencies, you’ll find more character elsewhere.
EUR/USD Characteristics and Behavior
Typical Daily Range
Under normal market conditions, EUR/USD moves 60–80 pips in a day. On more active days that stretches to 80–120 pips, and during high-impact news or crisis periods you can see 150–250 pips or more. What that means in practice depends on your trading style. Scalpers work with targets of 5–10 pips per trade. Day traders typically aim for 20–50 pips. Swing traders target 80–150 pips or more, while position traders work on 200–500 pip moves over weeks or months.
Trending vs. Ranging Behavior
EUR/USD spends roughly 30–40% of its time in clear directional trends, which is where trend-following strategies perform best. Another 40–50% of the time the pair moves within a range, making it fertile ground for support/resistance and mean-reversion approaches. The remaining 20–30% is choppy and directionless — conditions where it’s better to stay out than force trades. Both trend-following and range-trading strategies work well in EUR/USD trading. The key is identifying which state the market is in before committing a position.
Correlation with Other Pairs
EUR/USD moves in the same direction as GBP/USD with a correlation of 0.85–0.90 — close enough to be nearly identical at times. AUD/USD runs at 0.70–0.80, and NZD/USD sits around 0.70–0.75. On the negative side, USD/CHF is almost perfectly inverse at -0.90 to -0.95, and USD/JPY carries a moderate negative relationship from -0.60 to -0.70.
The practical implication matters: if you’re trading EUR/USD long while also long GBP/USD or short USD/CHF, you’re essentially taking the same trade three times and tripling your exposure to a single market move. Understanding these correlations is essential for managing true portfolio risk.
Response to News and Events
EUR/USD reacts most strongly to U.S. economic data. Non-Farm Payrolls, Federal Reserve rate decisions, CPI, and GDP releases carry the most weight. From the European side, ECB rate decisions and the press conference that follows are the biggest market movers, along with German economic data — particularly manufacturing PMI and the IFO business climate survey — since Germany drives the Eurozone economy. Broader risk sentiment and stock market performance also shape the pair’s direction.
The relationship is consistent: EUR/USD tends to rise when Eurozone data beats expectations, U.S. data disappoints, risk appetite is healthy, or the ECB is turning hawkish relative to the Fed. It tends to fall when U.S. data beats, Eurozone data disappoints, risk-off sentiment takes hold, or the Fed is tightening policy more aggressively than the ECB.
Best Times to Trade EUR/USD
Session Breakdown
The Asian session (7:00 PM – 4:00 AM ET) is the quietest stretch of the day for EUR/USD. Typical ranges sit at just 20–30 pips, liquidity is low, volatility is minimal, and spreads tend to widen. Unless you’re managing an existing swing trade, this session is generally one to skip.
The London session (3:00 AM – 12:00 PM ET) is where EUR/USD comes alive. Ranges of 50–80 pips are normal, liquidity is very high, and directional trends frequently establish themselves in the first two hours between 3:00 and 5:00 AM ET. This session suits day traders and scalpers well.
The New York session (8:00 AM – 5:00 PM ET) brings strong volatility of its own, particularly in the morning when U.S. economic data hits at 8:30 AM ET. Typical ranges run 60–90 pips, and all trading styles perform well here.
The London–New York overlap (8:00 AM – 12:00 PM ET) is the best four-hour window of the trading day. Liquidity is at its absolute peak, spreads hit their tightest, execution is fastest, and 40–60 pips of movement in just those four hours is common. If you can only dedicate one window to EUR/USD trading, this is it.
Optimal Trading Windows
Scalpers get the best conditions during the London–New York overlap from 8:00 AM to noon ET. The London open from 3:00 to 5:00 AM is a reasonable secondary option. For EUR/USD trading, the Asian session should be avoided entirely as should the late New York session once activity drops off after noon.
Day traders have the widest productive window — the full stretch from London open through the overlap, running 3:00 AM to noon ET. Trading into the late New York session until 3:00 PM can work on active days, but the Asian session and anything after 4:00 PM ET rarely justify the effort.
Swing traders care less about specific session timing since positions stay open for multiple days. The practical consideration is getting a good fill, which means entering during London or New York hours. Once the trade is on, you can monitor it at any time.
For position traders, session timing is almost entirely irrelevant. Entries are driven by weekly and monthly technical or fundamental setups, not intraday windows.
Days of the Week
Monday tends to be the slowest day of the trading week. Markets are digesting weekend news and positioning is cautious, which keeps ranges on the smaller side. Tuesday through Thursday are consistently the most productive days — economic data clusters in the middle of the week, volatility is higher, and trending moves are more likely to develop and sustain. Friday brings position squaring as traders close out before the weekend. The morning can be volatile as profits are taken, but activity tends to dry up after noon ET. The best practice is to avoid EUR/USD before 6:00 AM ET on Mondays and to step back after midday on Fridays.
EUR/USD Trading Strategies
Trend-Following with Moving Averages
This strategy trades pullbacks within an established trend using the 20, 50, and 200 EMAs on the 4-hour or daily chart. When price is above the 200 EMA, the trend is up. When it’s below, the trend is down.
In an uptrend, wait for price to pull back to the 20 or 50 EMA, then enter long when a bullish candle closes back above that level. In a downtrend, reverse the process — wait for a rally up to one of those EMAs and enter short when a bearish candle closes below them. Stop losses go 10–15 pips beyond the EMA or the most recent swing point. Aim for a minimum 2:1 risk-reward ratio, or trail the stop with the 20 EMA to stay in stronger-moving trends. This approach works best during the 30–40% of the time EUR/USD is in a clear directional trend.
As a practical example: EUR/USD is trending up with price at 1.1050 and the 200 EMA at 1.0900. Price pulls back to the 50 EMA at 1.1020, and a bullish engulfing candle closes at 1.1025. You enter long at 1.1030, stop at 1.1005 (25 pips), and target 1.1080 for 50 pips — a clean 2:1 ratio.
Range Trading with Support/Resistance
This strategy works during the 40–50% of the time EUR/USD trades within a defined range. Use the 1-hour or 4-hour chart, look for support and resistance levels with multiple touches, and add RSI or Stochastic to confirm overbought and oversold conditions.
For long entries, wait for price to reach support with RSI below 30 or Stochastic below 20, then look for a bullish rejection candle to confirm the bounce before entering. For shorts, look for price at resistance with RSI above 70 or Stochastic above 80, confirmed by a bearish rejection candle. Stops go 10–20 pips beyond the support or resistance level, and the target is the opposite side of the range or the midpoint for a more conservative exit.
Example: EUR/USD is ranging between 1.1000 support and 1.1080 resistance. Price drops to 1.1005 with RSI at 25. A pin bar forms rejecting support. Enter long at 1.1010, stop at 1.0990 (20 pips), target 1.1070 near resistance (60 pips).
Breakout Trading
Breakout trading targets the momentum that follows a sustained period of consolidation. On the 4-hour or daily chart, look for a clear pattern — triangle, rectangle, or flag — with well-defined boundaries. When the breakout comes, you want a strong momentum candle clearing the level, ideally with expanding volume if your broker provides that data.
Rather than chasing the initial breakout candle, wait for the retest. On a long, wait for price to pull back to the broken resistance level, which now acts as support, and enter on the bounce. On a short, wait for a rally back to the broken support, now acting as resistance. The stop goes inside the pattern on the opposite side, and the profit target is the height of the pattern projected from the breakout point. This setup works best after a sustained period of consolidation, especially ahead of major news events.
Example: EUR/USD consolidates in a triangle between 1.1020 and 1.1060. Price breaks above 1.1065 with a strong bullish candle, then pulls back to retest 1.1060. Enter long at 1.1065, stop at 1.1045 (20 pips), target 1.1105 — the full 40-pip height of the triangle added above the breakout level.
News Trading
News trading targets the sharp volatility following major economic releases. The events that move EUR/USD most are Non-Farm Payrolls, Federal Reserve rate decisions, CPI data, and ECB decisions. Before each release, note the consensus forecast and the previous reading so you can judge how significant any surprise might be.
When data significantly beats or misses expectations, wait 30–60 seconds for the initial spike to settle, then enter in the direction the market has decided on. Stop losses need to be wider than usual — around 20–30 pips — to account for the elevated volatility. Profit targets run 30–50 pips, or exit when momentum starts to fade. This is a high-risk approach suited only to experienced traders who are comfortable moving quickly in a fast-moving market.
Example: NFP was forecast at 180,000 and came in at 280,000 — a strong beat. EUR/USD drops 40 pips in the first minute. Wait for the first pullback after the initial spike, enter short at the retracement, and target an additional 30–40 pips as the dollar continues to strengthen.
2-5 Pip Scalping (Advanced)
Scalping EUR/USD means capturing small 2–5 pip moves repeatedly during the highest-liquidity window of the day. Use a 1-minute or 5-minute chart and trade only during the London–New York overlap from 8:00 AM to noon ET. The 5 and 10 EMAs provide basic directional bias, or you can work from pure price action once you’re comfortable reading it at speed.
Identify micro support and resistance, enter on the bounce with quick confirmation, and exit at the first sign of reversal or once you’ve captured your 3–5 pip target. Stop losses stay at 3–5 pips maximum. A 1:1 risk-reward ratio is acceptable here because the win rate on quality setups is high when conditions are right. Position sizes need to be larger than typical swing trade sizes to generate meaningful profit from such small moves.
This approach requires an ECN broker with raw spreads of 0.0–0.3 pips and fast execution. Discipline is everything — one bad trade held too long can wipe out several winning scalps. This style is not suited to beginners.
Technical Analysis for EUR/USD
Key Support and Resistance Levels
EUR/USD respects round numbers and psychological levels more reliably than almost any other major pair. The 1.2000 level has served as strong resistance across multiple market cycles. The 1.1500 area is a key medium-term pivot. The 1.1000 handle is major psychological support and has been tested and defended repeatedly. The 1.0500 level is a critical longer-term reference point, and parity at 1.0000 carries enormous psychological weight. At all of these levels, expect heightened volatility and watch for a clear price reaction before committing to a breakout or a bounce.
Best Indicators for EUR/USD
The three EMAs — 20, 50, and 200 — form the foundation of most technical approaches on this pair. The 20 EMA tracks short-term momentum, the 50 EMA reflects the medium-term trend, and the 200 EMA acts as the major long-term reference level that often doubles as significant support or resistance.
For oscillators, RSI with a 14-period setting is the standard choice — readings above 70 signal overbought conditions, below 30 indicate oversold. Stochastic (5,3,3) generates faster signals and works well for scalping entries. MACD (12,26,9) is best used for confirming trend direction and spotting divergence between price and momentum.
Volume adds useful context when it’s available through your broker. Expanding volume on a breakout strengthens the case for following the move. A rally on thin volume is often a warning sign worth heeding.
Bollinger Bands on the 20,2 setting are a practical addition. When price touches the upper band with RSI above 70, a reversal is worth watching for. The same logic applies at the lower band with RSI below 30. When the bands squeeze tightly together, a period of low volatility is ending and a sharp directional move is likely coming — useful context when positioning ahead of key events or levels.
Chart Patterns That Work Well
EUR/USD is one of the most reliable pairs for classical chart patterns. On the reversal side, head and shoulders formations — and their inverse — complete frequently and with meaningful follow-through. Double and triple tops and bottoms also appear regularly and produce clean entries when confirmed by indicator signals.
For continuation patterns, flags and pennants after strong directional moves offer some of the clearest entry setups on the pair. Triangles in all three forms — ascending, descending, and symmetrical — build and break out reliably. On the candlestick level, engulfing patterns at key support or resistance carry real weight, pin bars rejecting important levels are among the most reliable single-candle signals, and doji formations at price extremes often mark turning points worth monitoring closely.
Fibonacci Retracements
EUR/USD respects Fibonacci retracement levels consistently, making them a practical addition to any trend-trading approach. The three levels worth watching are 38.2%, 50.0%, and 61.8%. A shallow pullback to 38.2% signals a strong underlying trend with aggressive buying interest. The 50% retracement is the most common level where corrections pause and the original trend resumes. The 61.8% level is the deepest retracement that still suggests the trend is intact — breaks beyond it often signal the trend is failing.
To apply them in an uptrend, draw the Fibonacci tool from the swing low to the swing high and watch for price to slow and react at one of those three levels. Confirmation from a candlestick pattern or oscillator reading improves the quality of the entry significantly.
Fundamental Analysis for EUR/USD
U.S. Economic Indicators (Primary Drivers)
U.S. data is the primary driver of EUR/USD, with four releases carrying the most weight. Non-Farm Payrolls, released on the first Friday of each month at 8:30 AM ET, consistently produces the largest single-day moves on the pair. Federal Reserve interest rate decisions come eight times a year at 2:00 PM ET and set the longer-term tone for the dollar. CPI data lands monthly at 8:30 AM ET and has grown in importance as inflation became the central focus of monetary policy. GDP, released quarterly at 8:30 AM ET, shapes the broader economic narrative.
Retail sales, ISM manufacturing PMI, consumer confidence, and the unemployment rate carry moderate impact and can move the pair when they significantly surprise the market. The relationship is consistent: strong U.S. data pushes EUR/USD lower as the dollar gains, and weak U.S. data pushes it higher.
Eurozone Economic Indicators
On the European side, ECB interest rate decisions are the biggest market-moving events, arriving eight times a year. The press conference that follows each decision often generates more movement than the rate call itself, as markets react to the tone and forward guidance of the ECB president. Eurozone CPI and GDP releases carry similar weight to their U.S. counterparts.
German data holds particular importance because Germany drives the Eurozone economy. The German manufacturing PMI and the IFO business climate index are closely watched leading indicators, and German GDP often serves as a proxy for the broader European picture. French and Italian data are secondary but can move the pair when they diverge significantly from Germany. Strong Eurozone data supports EUR/USD; weak data pushes it lower.
EUR/USD trends are often driven by the divergence between these two institutions’ monetary policies. When the ECB is turning hawkish while the Fed is cutting rates — or when the Eurozone economy strengthens while the U.S. slows — the interest rate differential shifts in the euro’s favor and EUR/USD trends upward. The downtrend scenario is the reverse: a hawkish Fed raising rates while the ECB holds steady creates a differential that favors the dollar and pushes EUR/USD lower. Identifying policy divergence early, before it’s fully priced in, is one of the most powerful ways to position for multi-month trends on this pair.
Safe Haven Flows and Risk Sentiment
EUR/USD functions as a reliable barometer of global risk appetite. When markets are optimistic — stocks rising, the VIX low, Treasury yields climbing — the pair tends to drift higher as traders move toward risk assets and away from the dollar. When fear takes hold, the reverse happens: investors flee to the dollar as a safe haven, and EUR/USD falls.
The S&P 500 is the most useful single indicator to watch alongside EUR/USD. A rising S&P 500 generally supports the pair, while a sharp selloff tends to strengthen the dollar at EUR/USD’s expense. The VIX and gold price tell the same story from different angles — a rising VIX or surging gold signals risk-off conditions that typically weigh on EUR/USD.
Common EUR/USD Trading Mistakes
Trading Through Major News Without a Plan
EUR/USD can move 100+ pips in seconds during NFP or Fed decisions. Traders who hold positions through these events without a clear plan often face sudden large losses or have stops hit before the market settles. The sensible options are to close open positions 15 minutes before the scheduled release or to have a specific news-trading strategy in place before the event arrives. Simply hoping the position survives is not a plan.
Ignoring the Bigger Trend
Trying to short EUR/USD in a strong uptrend or go long during a prolonged downtrend is one of the most common and costly mistakes traders make. Always identify the daily and weekly trend before trading lower timeframes. If the daily chart is clearly trending up, short setups on the 15-minute chart deserve much more skepticism than long ones.
Overtrading During the Asian Session
EUR/USD barely moves during Asian hours (7 PM – 3 AM ET). Spreads widen, liquidity is thin, and price action tends to be choppy rather than directional. Forcing trades during this window produces predictably poor results. For most EUR/USD approaches, trading should start with the London session.
Not Accounting for Spread
With a 0.5–1.0 pip spread on standard accounts, you need 1–2 pips of favorable movement just to reach breakeven. That cost is easy to ignore in backtesting and easy to forget in the heat of live trading. Factor spread into your profit targets and minimum setup criteria — setups that look clean at zero cost may not justify the trade once the actual transaction cost is included.
Trading Both EUR/USD and Correlated Pairs
Going long EUR/USD and GBP/USD simultaneously is not two separate trades. With correlation running above 85%, the pairs move in near lockstep — when EUR/USD drops sharply, GBP/USD almost always drops with it. Holding both means you’ve doubled your position size on a single directional bet without realizing it. True diversification means moving toward pairs with lower or negative correlation, like USD/JPY or USD/CHF.
EUR/USD Trading Plan Template
Your EUR/USD Strategy
Before placing a single live trade on EUR/USD, you need a written plan. Decide on your primary approach — trend-following, range trading, breakout, news, or scalping — and commit to a specific timeframe, a primary indicator set (such as the 20/50/200 EMA), and one or two secondary tools (RSI, MACD, or Stochastic). Choose which sessions you’ll trade — London, NY, or the London–NY overlap — and establish exactly how you’ll calculate position size based on a fixed percentage of account risk per trade.
Entry Criteria Checklist
Before entering any EUR/USD trade, every item on this list should be a clear yes. If any answer is no, the trade doesn’t get taken.
[ ] Setup matches my defined strategy
[ ] Trading during my designated session
[ ] No major news in next 30 minutes
[ ] Clear stop loss level identified
[ ] Risk-reward minimum 1:2
[ ] I am calm and following plan (not emotional/revenge trading)
[ ] Chart screenshot taken
[ ] Position size calculated correctly
Risk Management Rules
Each trade risks a fixed percentage of your account, decided before you sit down at the charts. The stop loss goes on before you enter the position, not after, and it never gets moved further away from entry to avoid being stopped out — that’s how small losses become large ones. Position size comes from a simple formula: risk amount in dollars divided by the stop distance in pips multiplied by the pip value.
Set a maximum daily loss limit before you start trading, along with a cap on the number of trades per session. After a run of consecutive losses — decide your number in advance — stop trading for the day and review what happened. Apply the same discipline on a weekly basis with a maximum weekly drawdown limit that triggers a review if hit.
Performance Tracking
Every trade gets recorded: entry and exit levels, the setup type, your rationale, your emotional state at the time, the result, and what you learned. At the end of each week, review your win rate, your average winner versus average loser, which setups are performing, and what mistakes keep appearing. Choose one specific thing to improve the following week. Most of the real learning in trading happens in the journal, not during the trade itself.
EUR/USD Seasonal Patterns
Monthly Patterns
EUR/USD tends to show the most consistent trending behavior in January, when fresh institutional positioning for the new year gets underway, in March around quarter-end rebalancing flows, and in September as participants return from summer and position for year-end. August and late December are typically the quietest stretches of the year — European summer holidays thin out liquidity in August, and the holiday period does the same globally in December. These are tendencies worth knowing as background context, but they’re not a trading system. Trade what the chart is actually doing, not what the calendar suggests it should.
Yearly Cycles
EUR/USD tends to follow a loose annual rhythm. The first quarter often sees the establishment of the year’s primary trend as institutions deploy fresh capital. The second quarter frequently brings consolidation or continuation of that trend. The third quarter is historically the quietest period, running through the summer months with lower volatility. The fourth quarter tends to pick up again as year-end positioning and rebalancing create more directional movement. These are historical tendencies, not certainties, and individual years frequently deviate from the pattern.
EUR/USD vs Other Major Currency Pairs
EUR/USD vs GBP/USD
EUR/USD and GBP/USD move closely together, with correlation typically running between 0.85 and 0.90. Both pairs use the dollar as the quote currency and represent large developed economies, but the practical differences matter.
Cable runs hotter. GBP/USD daily ranges tend to be 20–30% wider than EUR/USD, which appeals to traders looking for larger moves on individual positions. The tradeoff is wider stops and more exposure to political shocks — budget crises, central bank surprises, and policy uncertainty — that tend to jolt sterling without warning. EUR/USD offers more stable and predictable behavior with tighter spreads. For beginners and scalpers, that consistency is worth more than the extra range GBP/USD offers.
EUR/USD vs USD/JPY
USD/JPY and EUR/USD typically move in opposite directions when broad dollar sentiment is the driving force — a strengthening dollar pushes EUR/USD lower and USD/JPY higher at the same time. But this inverse relationship breaks down during risk-off events, when yen demand from safe haven buying can push USD/JPY lower even as EUR/USD is also falling.
EUR/USD is more sensitive to European data and ECB policy shifts. USD/JPY responds more directly to Bank of Japan interventions and Asian market dynamics. EUR/USD generally offers tighter spreads, while USD/JPY provides better opportunities during Asian session hours when it’s most active.
EUR/USD vs USD/CHF
EUR/USD and USD/CHF have an almost perfect negative correlation (-0.90 to -0.95), meaning they move in opposite directions nearly all the time. This inverse relationship exists because Switzerland and the Eurozone are geographically close with strong economic ties, and the Swiss franc often moves with the euro.
When EUR/USD rises, USD/CHF almost always falls by a similar percentage. Traders should avoid simultaneously trading both pairs in the same direction, as it essentially doubles exposure to the same market move. EUR/USD typically offers better liquidity and tighter spreads than USD/CHF.
EUR/USD vs AUD/USD
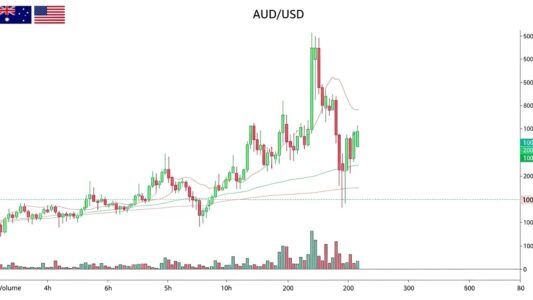
EUR/USD and AUD/USD are positively correlated (0.70-0.80), though less tightly than EUR/USD and GBP/USD. Both tend to rise during risk-on environments and fall during risk-off periods, with AUD/USD being more sensitive to commodity prices and Chinese economic data.
AUD/USD generally exhibits higher volatility than EUR/USD and responds more dramatically to changes in risk appetite. EUR/USD offers more consistent trading opportunities throughout European and US sessions, while AUD/USD is particularly active during Asian session hours when Australian economic data is released.
EUR/USD vs USD/CAD
EUR/USD and USD/CAD share a moderate negative correlation running from -0.60 to -0.75. A weakening dollar lifts EUR/USD and tends to weigh on USD/CAD at the same time. But crude oil prices regularly override this relationship — CAD is heavily tied to oil, and sharp moves in crude can drive USD/CAD independently of what the dollar is doing elsewhere.
USD/CAD tends to be more range-bound than EUR/USD, with clearer support and resistance levels. EUR/USD is less exposed to commodity price swings, making it a cleaner vehicle for purely technical strategies that don’t require monitoring oil markets alongside the forex chart.
EUR/USD vs NZD/USD
EUR/USD and NZD/USD share a 0.70–0.75 positive correlation, similar to the EUR/USD and AUD/USD relationship. Both pairs respond to shifts in broad dollar strength and global risk sentiment, moving in the same direction most of the time. NZD/USD typically shows even wider daily ranges than AUD/USD, making it the most volatile of the three.
EUR/USD offers significantly tighter spreads and deeper liquidity, making it the better choice for scalping and higher-frequency strategies. NZD/USD can produce larger moves on individual swing trades due to its wider ranges, but it requires wider stops and more careful position sizing. Beginners should stay with the more liquid and predictable pair.
EUR/USD earns its status as the world’s most traded currency pair. The liquidity is unmatched, the spreads are the tightest in retail forex, price action respects technical levels reliably, and opportunities exist across every trading style and timeframe. There is no better pair to learn on, and no better foundation for building a systematic EUR/USD trading approach
Trading it consistently well requires more than familiarity with the pair’s behavior. It means knowing your strategy and executing it without deviation, trading during the sessions where EUR/USD is most active, staying current on both U.S. and Eurozone economic developments, and applying risk management that protects your capital through losing streaks. Keeping detailed records and doing regular review work is what turns experience into measurable improvement.
Whether you’re a scalper targeting 3–5 pips during the London session, a day trader taking setups around the NFP release, or a swing trader positioned for a multi-week trend following an ECB policy shift, EUR/USD gives you the conditions to trade well. Start on a demo account, test your approach rigorously, and move to live trading only after you’ve shown yourself consistent results. The pair rewards preparation and punishes impatience.
Expand Your Currency Trading Knowledge
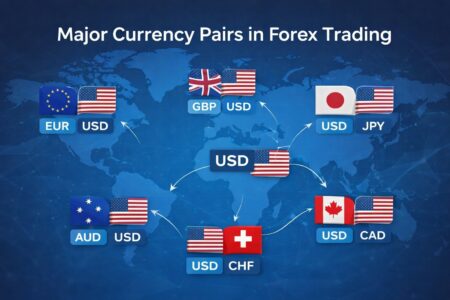
If EUR/USD has given you a solid foundation, the other major pairs each offer their own distinct characteristics worth understanding. The GBP/USD Trading Guide covers what makes Cable volatile and how to approach it. The USD/JPY Trading Guide explains the safe-haven dynamics of the yen and what drives the pair. For the Swiss franc and its near-perfect inverse relationship with EUR/USD, the USD/CHF Trading Guide is the right place to start. The oil-correlated Canadian dollar is covered in the USD/CAD Trading Guide, while the AUD/USD Trading Guide and NZD/USD Trading Guide cover the commodity-sensitive antipodean pairs.