Learn How to Make Fast Money by Learning diffrent Strategies in Forex Trading and Different Investment Options
The Basics of Oil Trading: What Every Trader Needs to Know
Understanding the basics of oil trading starts with knowing why oil drives every other market and no single commodity moves the financial markets the way oil does. One OPEC announcement can push prices 10% in hours. A pipeline shutdown in the Middle East can spike energy stocks before you even open your trading platform. If you trade forex, commodities, or stocks — you’re already affected by oil. You just may not be tracking it yet.
What Is Crude Oil and Why Does It Matter?
Crude oil is a liquid fossil fuel. It forms from the remains of ancient organisms compressed under rock and sediment for millions of years. Once extracted through drilling, it gets refined into the products everything runs on: gasoline, diesel, jet fuel, heating oil, plastics.
The global economy doesn’t just use oil. It depends on it. It fuels the trucks that move goods. The factories that produce them. The planes that carry people across continents. When oil prices rise, costs go up across the entire supply chain. When they fall, consumers spend more because they’re paying less at the pump.
The U.S. Energy Information Administration puts global daily consumption at around 100 million barrels. That’s why crude oil is one of the most traded commodities on the planet.
Three countries produce most of the world’s oil: the United States, Saudi Arabia, and Russia. Combined, they supply roughly 40% of global output.
The U.S. became the world’s largest producer after the shale revolution. Hydraulic fracturing unlocked massive reserves in Texas, North Dakota, and New Mexico that weren’t accessible before. Saudi Arabia controls the world’s largest conventional reserves through Saudi Aramco. Russia exports heavily to Europe and Asia through its pipeline network.
Beyond those three, major producers include Iraq, UAE, Canada, Iran, Kuwait, and Brazil. Each country’s production levels, export policies, and geopolitical situation feed directly into global prices.
How OPEC Controls the Price
OPEC — the Organization of the Petroleum Exporting Countries — was founded in 1960. It currently has 13 member nations. Saudi Arabia holds the most influence.
OPEC’s mission is to coordinate production among member countries to stabilize the market. In practice, that means controlling how much oil flows into the global supply. Cut production, prices rise. Open the taps, prices fall.
In 2016, OPEC brought Russia into the fold under the OPEC+ framework. That added even more control over global output. When OPEC+ announced production cuts in 2022 and 2023, prices jumped immediately. When members flooded the market in the mid-2010s, prices collapsed from over $100 a barrel down into the $30s.
No other organization has this level of influence over a single commodity. Traders watch OPEC meeting dates the same way forex traders watch central bank announcements.
WTI vs. Brent: The Two Benchmarks
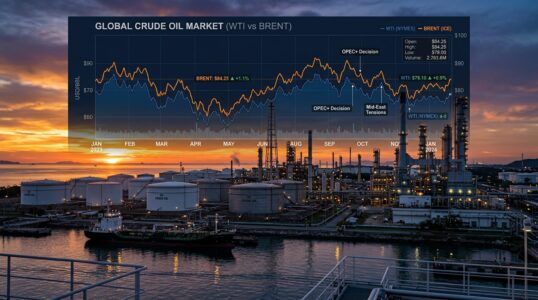
You’ll see two oil prices quoted constantly: WTI and Brent. They’re not the same.
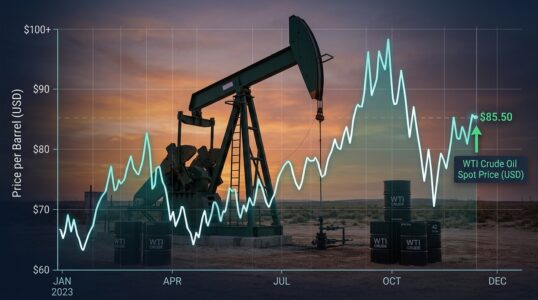
WTI (West Texas Intermediate) is the U.S. benchmark. It’s sourced from oil fields in Texas and the Gulf of Mexico and trades on the NYMEX exchange in New York. It’s the primary reference price for North American crude.
Brent Crude is the global benchmark. Originally sourced from North Sea fields off Scotland and Norway, it trades on the Intercontinental Exchange in London. About two-thirds of internationally traded crude oil is priced against Brent.
Brent usually trades slightly higher than WTI. The gap between them — the Brent-WTI spread — reflects transportation costs, regional supply dynamics, and demand differences. When that spread widens sharply, something is shifting in either U.S. or global supply conditions.
For the practical side — instruments, leverage, how to actually place a trade — see the full breakdown in crude oil trading.
How Oil Prices Move Currencies
This is where forex traders need to pay attention.
Countries that export oil see their currencies strengthen when oil prices rise. The clearest examples:
Canadian Dollar (CAD): Canada is one of the world’s largest oil exporters. The CAD is so tied to oil it’s known as a petrocurrency. When oil rises, USD/CAD typically falls — the Canadian dollar strengthens. When oil drops, USD/CAD climbs.
Norwegian Krone (NOK): Norway’s entire sovereign wealth fund is built on North Sea oil revenues. The NOK tracks oil prices closely.
Russian Ruble (RUB): Russia’s government budget depends heavily on oil and gas exports. When prices collapsed in 2014–2016, the ruble lost half its value.
Countries that import oil face the opposite. Japan imports nearly all of its energy. When prices spike, Japan’s trade deficit widens and the yen comes under pressure.
Then there’s the dollar relationship. Nearly all global oil contracts are priced in USD. When the dollar strengthens, oil gets more expensive for buyers using other currencies — demand tends to fall, prices drop. When the dollar weakens, oil gets cheaper internationally, demand picks up, prices rise. That inverse relationship matters for every forex trader.
How Oil Moves Stock Markets
Oil price changes hit equity markets fast — and unevenly.
Energy companies are the direct winners when prices rise. Exxon, Chevron, BP, Shell, ConocoPhillips — their profits increase with every dollar added to the barrel price. Their stocks follow. When oil falls, these same stocks get hit hard.
Airlines go the other way. Fuel is one of their largest costs. Rising oil prices compress margins. Southwest, Delta, United — all of them tend to underperform when crude is spiking.
Consumer spending feels it too. When gas prices climb, people have less money for retail, restaurants, and discretionary purchases. That shows up in earnings reports within a quarter or two.
EIA inventory data, released every Wednesday at 10:30 AM Eastern
Demand side:
Global GDP growth
China’s industrial output — China is now the world’s largest oil importer
Seasonal demand shifts (heating oil in winter, gasoline in summer)
Long-term EV adoption trends
Market sentiment:
Hedge fund positioning in futures markets
U.S. dollar strength
Risk-on vs. risk-off conditions — oil often falls when markets are panicking
The EIA’s Weekly Petroleum Status Report is one of the most market-moving data releases in commodities. A larger-than-expected inventory build pushes prices lower. A bigger-than-expected draw pushes them higher. Wednesday at 10:30 AM — put it in your calendar.
Why Traders Follow Oil Even When They Don’t Trade It
Oil is a leading economic indicator. Demand reflects what’s happening in global factories and shipping lanes. When Chinese industrial output is running hot, oil demand climbs. When recession fears grow, oil often falls before the economic data shows it. Traders who follow oil get earlier reads on where the global economy is heading.
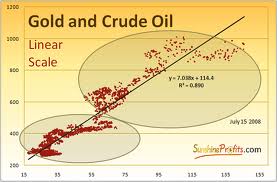
It’s also a sentiment signal. Oil falls in risk-off environments and rises when growth expectations are strong. Watching oil alongside gold gives you a useful cross-check on where market mood is sitting.
And for forex traders, ignoring oil means missing half the story on CAD, NOK, and multiple emerging market currencies.
If you’re building a diversified trading approach rather than chasing individual commodity moves, see how oil fits into a broader alternative investment strategy.
The Basics of Oil Trading: Ready to Start?
Understanding the fundamentals is step one. Step two is knowing which instruments to use, how leverage works, how to read oil charts, and how to manage risk properly. That’s all covered in the companion guide to crude oil trading.